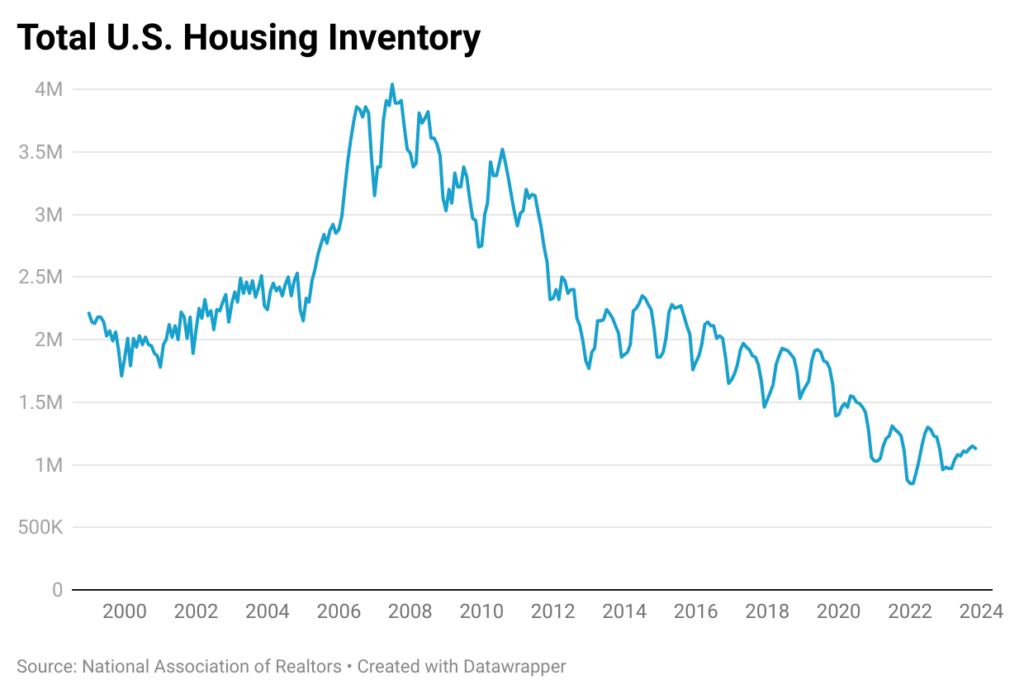
Total housing inventory in the U.S. has averaged between 2 and 3 million units over the past 40 years with the exception of during the subprime financial crisis between 2007 and 2012 when it gapped up as high as 4 million units. However, by 2012, it was back down to 2 million units again. Yet over the past decade, we’ve seen inventory drop sharply to levels never seen in recent history – down to barely 1 million units for sale. What is going on?

Though we dropped to 2 million units in 2012 which was more aligned with historical norms, there was an additional pressure pushing this down even lower to 1.5 million units by 2019. Why? The key as to what was happening in 2012 was that the first of the Baby Boomer generation was starting to turn 65 years of age and beginning to retire. This put additional pressure on housing inventory because the average household size for those 60 and over in the U.S. is 2.1 persons whereas for those ages 18 to 59 is 3.2 persons. Thus, as the Baby Boomer population ages into the 65 and over category, their households will start to consume more housing units than when their numbers were not as large. This is primarily because their young adult children are moving out and forming their own households. And until 2029, the number of Baby Boomers aged 65 and above will continue to increase meaning this effect isn’t going away any time soon. So, this issue has been long in the making.
Although things would have naturally been tighter than normal with the aging of the Baby Boomers, when Covid hit in early 2020, things got even worse due to two additional reasons.
First, Covid stimulated dramatic demand from individuals who could suddenly work from anywhere who gave up expensive lifestyles as renters in large metro areas and purchased their own homes in smaller, less expensive towns. This effect pushed down housing supply even more.
Second, interest rates were certainly low and averaging between 4% and 5% in the months preceding Covid, but with the Fed’s extensive quantitative easing policy following Covid, those rates were pushed down further to the extraordinarily low level of 3%. This effect also stimulated huge demand for housing and further restricted supply.
Both these effects caused the housing shortage resulting from the aging of the baby boomers to be significantly worse.
And the bad news is that the shortage in housing isn’t going to get better any time soon. As mentioned earlier, the Baby Boomers’ retirement wave is going to continue until the end of the decade. And though interest rates are higher now and near 7%, nearly 75% of homeowners have mortgages that are locked-in at a fixed rate of 4% or less! This isn’t going away either. It won’t be easy to convince someone to downsize or move to a different location and to sign up for a mortgage where the new interest rate will be more than double what they currently are paying. These individuals are reasoning that their current home has a locked-in lower interest rate and lower monthly payment than a smaller home or a home in a different locale that they were originally planning to move to.
The only good news from all of this is that Covid is a distant memory, and as the Baby Boomers age and homebuilders gradually decide to increase inventory, things will eventually improve with our housing stock. But don’t expect that to happen anytime soon.


